Pay gaps at the University of Leeds


As a large employer, the University must annually report its gender pay gap. The University also chooses to go beyond legal requirements and to publish its ethnicity and disability pay gaps, as part of a commitment to good Equity, Diversity and Inclusion (EDI) practice.
On this page, you can find information about pay gaps, why they exist and most importantly – what the University is doing to address them.
What are pay gaps?


Pay gaps are the percentage difference between the average hourly rates of pay for different groups. For example, if the average hourly pay for women in an organisation was £13 and for men was £15, then the difference would be £2, a 13% gender pay gap.
Both the mean (from the average) and median (from the middle value) pay gaps are calculated. Mean pay gaps tend to be higher as they’re influenced by extremes, such as a smaller number of people with very large salaries.
Pay gaps are different to equal pay. Equal pay is legislation that stipulates men and women in the same employment performing equal work must receive equal pay. Pay gaps look at average pay across an organisation.
The University’s pay gaps

Gender pay gap
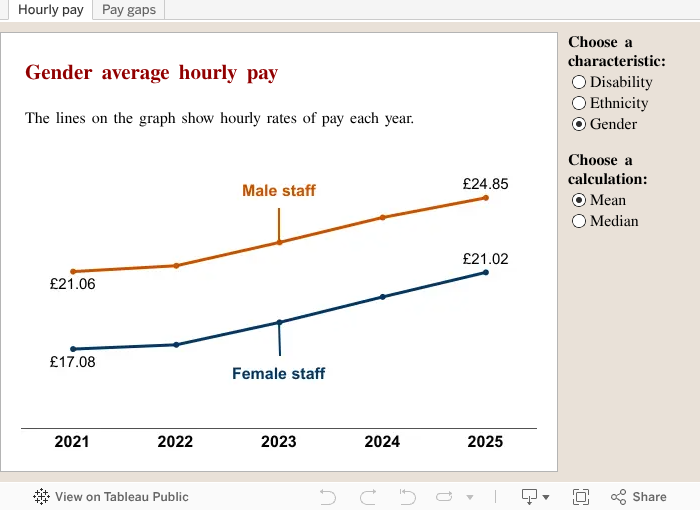
In 2025, the mean gender pay gap at the University was 15.4%, down from 17.1% in 2024. This is the lowest mean pay gap since the University started reporting in 2017 when the mean gender pay gap was 22.5%. The 2025 median gender pay gap was 12.6%, down from 13.4% in 2024.
The University’s gender pay gap is above Russell Group averages (mean: 15.1%, median: 11.5%), and sector averages (mean: 13.6%, median: 11.5%, UCEA analysis 2024).
Ethnicity pay gap
The ethnicity pay gap is the percentage difference between the average hourly rates of pay for Black, Asian and minoritised ethnic staff, and white staff.
In 2025, the mean ethnicity pay gap at the University was 9.9%, down from 10.5% in 2024. The mean ethnicity pay gap has been between 9.7% and 10.5% since reporting began in 2021. The 2025 median ethnicity pay gap was 6.6%, up from 6.3% in 2024.
The University’s ethnicity pay gap is below Russell Group averages (mean: 11.0%, median: 7.4%), but above sector averages (mean: 7.7%, median: 4.7%, UCEA analysis 2024).
Disability pay gap
The disability pay gap is the percentage difference between the average hourly rates of pay for disabled staff and non-disabled staff.
In 2025, the mean disability pay gap at the University was 7.6%, down from 8.9% in 2024. The 2025 median disability pay gap was 5.6%, down from 7.1% in 2024.
The University’s disability pay gap is below the sector mean of 8.5% and below the sector median of 9.6% (Advance HE Staff Statistical Report 2024).
Explore the data
In the following graphs, you can see hourly pay and the University pay gaps by year. The filters allow you to swap between characteristics and the mean/median pay gaps. Hover over the graph lines and bars for more information.
Why do pay gaps exist?


The principle reason pay gaps exist is because of the unequal distribution of women, minoritised ethnic and disabled staff across pay grades.
For example, in 2025, 67% of professors in the University were men. This increases the average male hourly rate (as professors are the highest paid staff in the University) and so contributes to the gender pay gap.
Analysing pay distribution
To look at pay distribution, staff are divided into four equal sized groups – or quartiles – based on their hourly pay. This shows which groups make up the lowest, two middle and highest paid quartiles of the University.
The following graphic shows the 2025 pay quartiles, and the approximate spread of grades across each quartile:

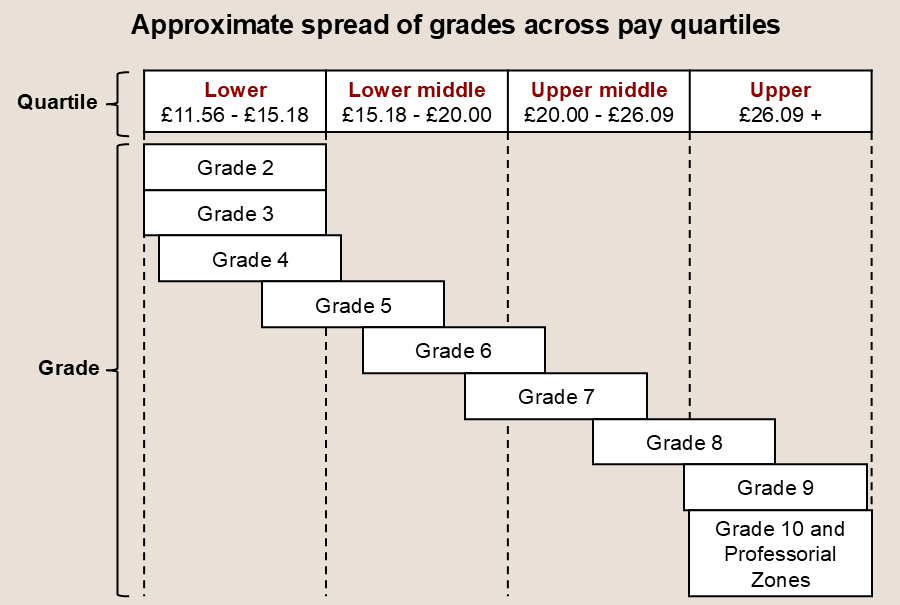
The lower quartile represents staff earning between £11.56 and £15.18 per hour, and covers approximately grades 2 to 4, and a small portion of grade 5.
The lower middle quartile represents staff earning between £15.18 and £20.00 per hour, and covers the majority of grades 5, 6 and a small portion of grade 7.
The upper middle quartile represents staff earning between £20.00 and £26.09 per hour, and covers most of grade 7 and nearly half of grade 8.
The upper quartile represents staff earning over £26.09 per hour, and covers just over half of grade 8, and all of grades 9, 10 and the Professorial Zones.
Analysing pay quartiles helps explain why pay gaps exist and supports the identification of evidence-based actions/initiatives to tackle them.
Pay distribution by gender
The data shows that women are overrepresented in lower-paid roles – 66.9% of the lower quartile are women; and underrepresented in higher-paid roles – 44.7% of the upper quartile are women.
Between 2024 and 2025, there has been a larger increase in the proportion of women in the upper quartile (+1.5 percentage points, pp) and smaller increase in the lower middle (+0.6pp) and lower (+0.4pp) quartiles. There’s been a decrease in the proportion of women in the upper middle quartile (-1.6pp).
In 2025, of the highest earners at the University (salary over £100,000), 33% were women (+2pp since 2024). Women make up 58% of staff.
Pay distribution by ethnicity
There are roughly equal proportions of minoritised ethnic staff across quartiles which makes the ethnicity pay gap smaller than the gender pay gap – but the proportion of staff who have not recorded their ethnicity make analysis less reliable.
Between 2024 and 2025, the proportion of minoritised ethnic staff has increased in the upper pay quartile (+0.8pp), upper middle quartile (+2.4pp) and lower middle quartile (+1.7%). The proportion of minoritised ethnic staff has decreased in the lower quartile by 0.4pp.
In 2025, of the highest earners at the University (salary over £100,000), 9% were minoritised ethnic staff (+1pp since 2024). Minoritised ethnic colleagues make up 15% of staff.
Pay distribution by disability
The proportion of staff who have not recorded whether they’re disabled makes disability pay gap analysis less reliable. At 31 March 2025, 31% of staff had not told us whether they’re disabled.
Between 2024 and 2025, there has been an increase in the proportion of disabled staff across all quartiles – +0.1pp in the lower quartile, +0.9pp in the lower middle quartile, +1.3pp in the upper middle quartile and +0.3pp in the upper quartile.
In 2025, of the highest earners at the University (salary over £100,000), 2% were disabled (-1pp since 2024). Disabled colleagues make up 7% of staff.
Explore the data
In the following graph, you can explore the pay quartiles and grade distribution of the University by gender, ethnicity and disability.

Bonus gaps

In addition to pay gaps, the University is required to publish its bonus gaps – the difference between the average bonus amounts received by different groups of staff. Disability bonus gaps are not calculated as the sample size is too small to produce reliable data.
The University of Leeds offers discretionary bonuses but not contractual ones. These include one-off payments (for outstanding contributions), reward vouchers from the University Recognition Scheme and Clinical Impact Awards.
Clinical Impact Awards (CIAs) are mandated, decided upon and funded by the NHS, and given to outstanding clinical staff. CIAs significantly skew the University’s overall bonus gaps as the amounts awarded can be much higher than the University’s typical bonuses.
Men are more likely to be awarded – in 2025, 40 men and 5 women were awarded CIAs.
Gender bonus gap
In 2025, 9.5% of female staff received a bonus, compared to 10.3% of male staff.
The mean gender bonus gap including CIAs was 76.3% and excluding CIAs was 27.5%. The median gender bonus gap including CIAs was 0%, and including CIAs was 10.0%.
Ethnicity bonus gap
In 2025, 8.5% of minoritised ethnic staff received a bonus compared with 22.0% of white staff.
The mean ethnicity bonus gap including CIAs was 32.5% and excluding CIAs was 16.1%. The median ethnicity bonus gap including CIAs was 15.0% and excluding CIAs was 25.0%.
Explore the data
In the following graph, you can explore the University’s gender and ethnicity bonus gaps over the years.

What is the University doing about pay gaps?


The EDI Strategy and Implementation Plan
The EDI strategy, underpinned and supported by the EDI Delivery Plan, aims to tackle many of the underlying structural inequalities that contribute pay gaps. It focuses on improving systems and policies, developing people and creating a culture which encourages all to succeed.
Athena Swan
The University is currently undertaking an institutional self-assessment for the Athena Swan charter. The process will identify issues around gender inequality in the University, with an action plan developed (aligned other institutional plans/strategies). The actions will seek to address many of the issues which create pay gaps.
Faculty Athena Swan submissions and activities continue to drive change on a local level within faculties and schools.
Race Equality Charter
At the end of 2025, the University applied to the Race Equality Charter, producing an action plan which will be delivered over the coming 5 years. Several actions focus on barriers to recruitment and career progression for minoritised ethnic staff – issues which contribute to the ethnicity pay gap.
Support for disabled staff
The University is continuing to implement strategic activity endorsed by the University Executive Group (UEG) to improve support for disabled staff. This includes embedding a new reasonable adjustments process and introducing a central fund for reasonable adjustments. The new two-year fund will be administered by an appointed Reasonable Adjustments Fund Advisor.
A task and finish group is overseeing further work to enhance support for disabled staff, such as exploring the provision of training and specialist dedicated support.
Career pathways
The Career Pathways programme led by People and Culture will ensure transparent progression through developing typical career pathways and standard job profiles. It will streamline support and development opportunities, and develop the academic promotions criteria in line with extensive feedback. Equity and inclusion will be at the core of the project, meaning all staff have equitable opportunities to grow and advance.
Improving data
Data quality has a significant impact on the reliability of the ethnicity and disability pay gap reporting. Prior to the launch of the new HR system in 2026, the EIU and HR Management Information team will work closely with the Corporate Processes and Systems (CPS) programme to ensure we’re collecting equalities information in an effective way.
About the data


The University is required to include all employees and casual workers in its calculations (referred to as ‘staff’ on this page). Casual workers are engaged by the University to support educational activity and short-term temporary assignments.
The data used in the calculations counts all staff on 31 March each year. The written analysis on this page covers data from 31 March 2025.
Within gender data, non-binary staff are removed from analysis. The small sample size for this group makes analysis unreliable.
In the ethnicity and disability data, there is a field titled ‘Unknown staff’ – this includes staff who have not recorded their ethnicity or whether they are disabled. Many of these staff are casual workers.
Having large numbers of ‘Unknown staff’ in the data makes it less reliable and means drawn conclusions are less certain.